


CounterPath Reports Second Quarter Fiscal 2019 Financial Results
Vancouver, BC, Canada — December 12, 2018
CounterPath Corporation (NASDAQ: CPAH) (TSX: PATH) (the “Company” or “CounterPath”), a global provider of award-winning over-the-top (OTT) Unified Communications (UC) solutions for enterprises and service providers, today announced the financial and operating results for its quarter ended October 31, 2018, being the second quarter of fiscal year 2019.
First Quarter Financial Highlights (unaudited)
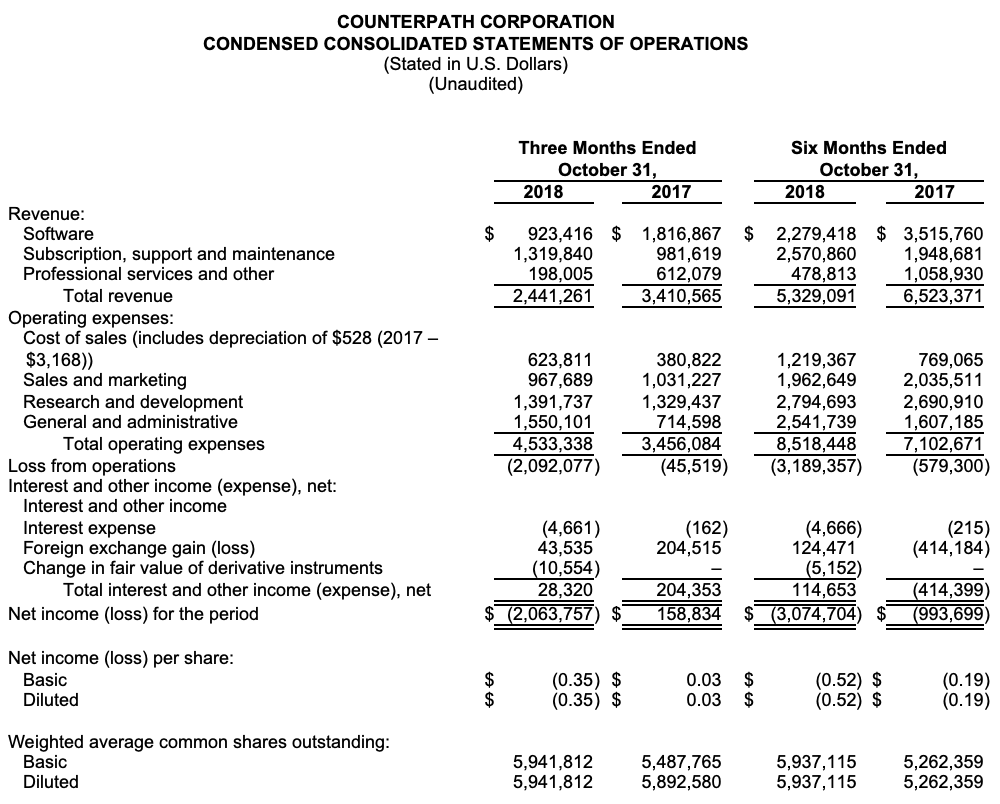
- Revenue of $2.4 million compared to revenue of $3.4 million for the second quarter of fiscal 2018.
- Growth in subscription, support and maintenance revenue (revenue of a recurring nature) of 34% for the quarter compared to second quarter of fiscal 2018.
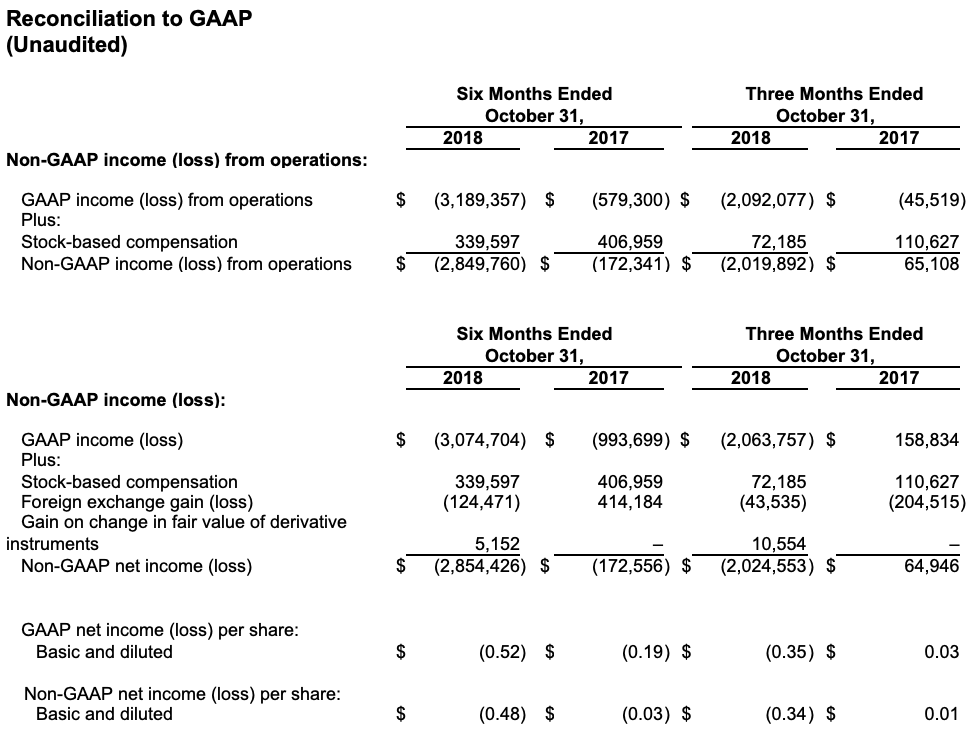
- Non-GAAP loss from operations of $2.0 million compared to non-GAAP income from operations of $0.1 million for the second quarter of fiscal 2018.
- Net loss of $2.1 million, or $0.35 per share, compared to net income of $0.2 million, or $0.03 per share, for the second quarter of fiscal 2018.
- Non-GAAP net loss of $2.0 million, or $0.34 per share, compared to non-GAAP net income of $0.1 million, or $0.01 per share, for the second quarter of fiscal 2018.
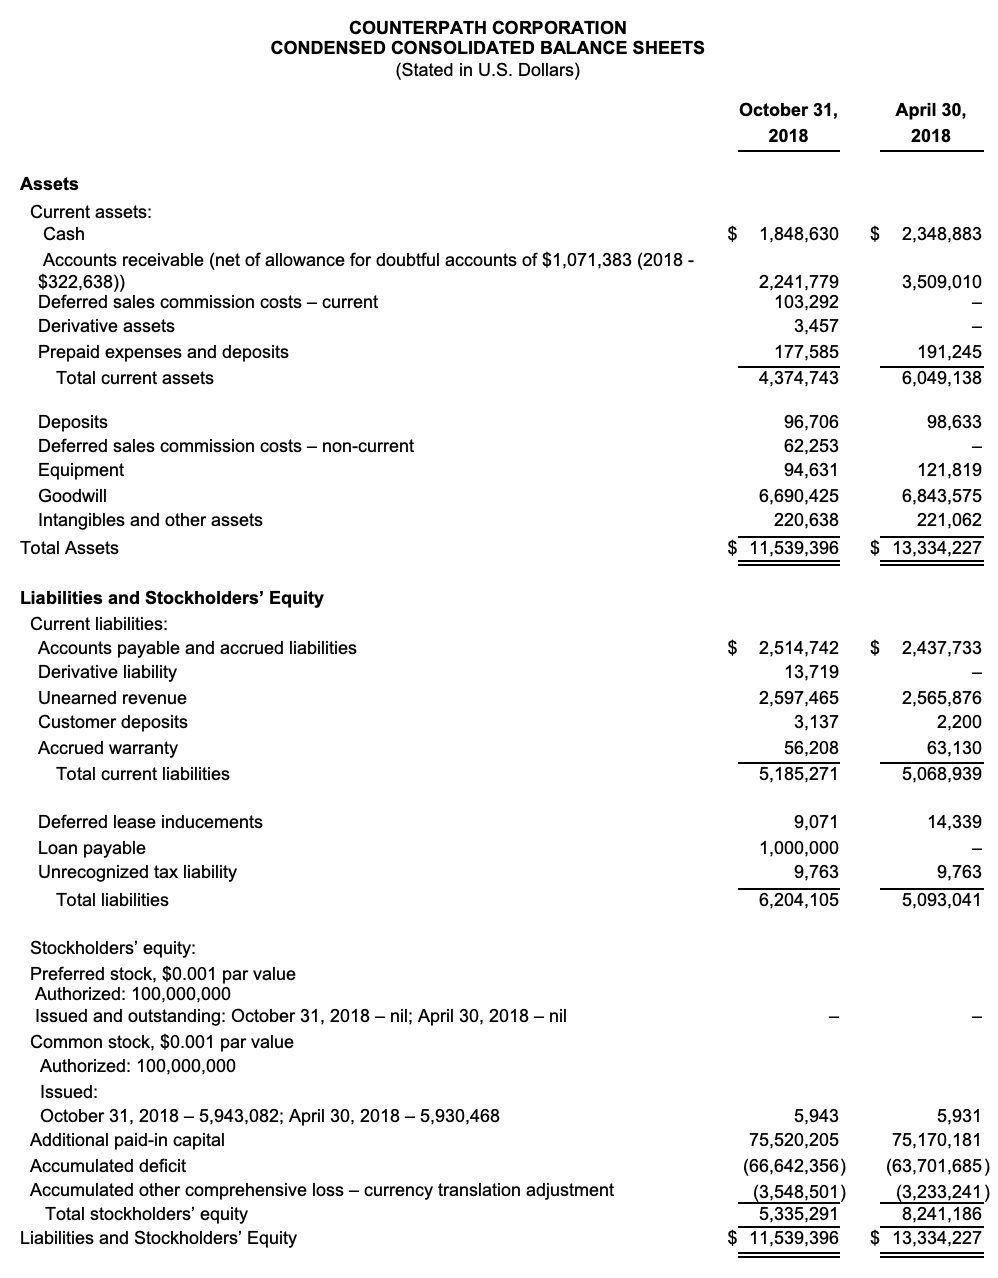
- Cash of $1.8 million as of October 31, 2018 compared to cash of $2.3 million as of April 30, 2018.
Management Commentary
“Continuing with the trend we experienced in the first quarter, we had strong growth in recurring revenue” said David Karp, Interim CEO and CFO. “Our recurring revenue business contributed to more than 50% of the total revenue, and was at the highest level ever for CounterPath. Another milestone for the Company was achieved in the second quarter with the launch of Bria Teams. This latest Software-as-a Service (SaaS) offering combines all of CounterPath’s core technologies with newly introduced services such as team voice and video calling; in addition to secure corporate instant messaging, presence, message synchronization and screen sharing, all hosted by CounterPath from the cloud. This subscription-based offering will contribute to additional recurring revenue growth and is targeted towards new users within the small and medium-sized business (SMB) enterprise market. Furthermore, we are expanding our product portfolio to address the demand for support in virtual desktop infrastructure (VDI) environments. This included a customer contract last quarter with one of the top ten call center service providers looking to enable voice capability for work-at-home users across various VDI hardware clients. As more employees work remotely rather than in a corporate office setting, implementation of cloud-based virtual desktop infrastructure (VDI) is increasing. According to the Research and Markets report, the global desktop virtualization market is projected to grow from USD 7.83 Billion in 2017 to USD 13.45 Billion by 2022, at a Compound Annual Growth Rate (CAGR) of 11.4% during the forecast periodi.” continued Karp.
Financial Overview
(All amounts in U.S. dollars and in accordance with accounting principles generally accepted in the United States (“GAAP”) unless otherwise specified – unaudited).
Revenue was $2.4 million for the quarter ended October 31, 2018 compared to $3.4 million for the same quarter in the last fiscal year. Software revenue was $0.9 million compared to $1.8 million for the same quarter in the last fiscal year, subscription, support and maintenance revenue was $1.3 million compared to $1.0 million for the same quarter in the last fiscal year, and professional services and other revenue was $0.2 million compared to $0.6 million for the same quarter in the last fiscal year.
Operating expenses for the quarter ended October 31, 2018 were $4.5 million compared to $3.5 million for the same quarter in the last fiscal year. Operating expenses for the quarter ended October 31, 2018 included a non-cash stock-based compensation expense of $0.1 million (2017 – $0.1 million) and a one-time accrual of $0.3 million related to the departure of the Company’s former chief executive officer. Cost of sales were $0.6 million for the quarter ended October 31, 2018 compared to $0.4 million for the same quarter in the last fiscal year. Sales and marketing expenses were $1.0 million for the quarter ended October 31, 2018 compared to $1.0 million for the same quarter last fiscal year. For the quarter ended October 31, 2018, research and development expenses were $1.4 million and general and administrative expenses were $1.6 million compared to $1.3 million and $0.7 million, respectively, for the same quarter in the last fiscal year.
Foreign exchange gain for the quarter ended October 31, 2018 was $0.04 million compared to $0.2 million for the same quarter last fiscal year. The foreign exchange gain (loss) represents the gain (loss) on account of translation of the intercompany accounts of the Company’s subsidiary which are maintained in Canadian dollars and transactional gains and losses resulting from transactions denominated in currencies other than U.S. dollars.
The net loss for the quarter ended October 31, 2018 was $2.1 million, or $0.35 per share, compared to a net income of $0.2 million, or $0.03 per share, for the same quarter in the last fiscal year. As of October 31, 2018, the Company had $1.8 million in cash, compared to $2.3 million at April 30, 2018.
Forward-Looking Statements
This news release contains “forward-looking statements”. Statements in this news release which are not purely historical are forward-looking statements and include any statements regarding beliefs, plans, outlook, expectations or intentions regarding the future, including (1) the statement that the launch of the Bria Teams will contribute to additional recurring revenue growth and is targeted towards new users within the small and medium-sized business (SMB) enterprise market; (2) the Company’s plan to expand its product portfolio to address the demand for support in virtual desktop infrastructure (VDI) environments; and (3) the expectation that the global desktop virtualization market will grow from USD 7.83 Billion in 2017 to USD 13.45 Billion by 2022, at a Compound Annual Growth Rate (CAGR) of 11.4%. It is important to note that actual outcomes and the Company’s actual results could differ materially from those in such forward-looking statements. Actual results could differ from those projected in any forward-looking statements due to numerous factors. Such factors include, among others: (1) the variability in the Company’s sales from reporting period to reporting period due to extended sales cycles as a result of selling the Company’s products through channel partners or the length of time of deployment of the Company’s products by its customers; (2) the Company’s ability to manage its operating expenses, which may adversely affect its financial condition and ability to continue to operate as a going concern; (3) the Company’s ability to remain competitive as other better financed competitors develop and release competitive products; (4) a decline in the Company’s stock price or insufficient investor interest in the Company’s securities which may impact the Company’s ability to raise additional financing as required or may cause the Company to be delisted from a stock exchange on which its common stock trades; (5) the impact of intellectual property litigation that could materially and adversely affect the Company’s business; (6) the success by the Company of the sales of its current and new products; (7) the impact of technology changes on the Company’s products and industry; (8) the failure to develop new and innovative products using the Company’s technologies including the refresh of our Software-as-a Service (SaaS) solution; and (9) the potential dilution to shareholders or overhang on the Company’s share price of its outstanding stock options. Readers should also refer to the risk disclosures outlined in the Company’s quarterly reports on Form 10-Q, the Company’s annual reports on Form 10-K, and the Company’s other disclosure documents filed from time-to-time with the Securities and Exchange Commission at www.sec.gov and the Company’s interim and annual filings and other disclosure documents filed from time-to-time on SEDAR at www.sedar.gov.
About CounterPath
CounterPath Unified Communications solutions are changing the face of telecommunications. An industry and user favorite, Bria softphones for desktop, tablet and mobile devices, together with Stretto Platform™ server solutions, enable operators, OEMs and enterprises large and small around the globe to offer a seamless and unified over-the-top (OTT) communications experience across both fixed and mobile networks. The Bria and Stretto combination enables an improved user experience as an overlay to the most popular UC and IMS telephony and applications servers on the market today. Standards-based, cost-effective and reliable, CounterPath’s award-winning solutions power the voice and video calling, messaging, and presence offerings of customers such as AT&T, Avaya, BroadSoft, BT, Cisco Systems, Metaswitch Networks, Mitel, NEC, Network Norway, Nokia, Ribbon Communications, Rogers and Verizon. Visit CounterPath, mrkt-stg.counterpath.com.
Contacts:
David Karp
Interim Chief Executive Officer and Chief Financial Officer, CounterPath
[email protected]
(604) 628-9364
Non-GAAP Financial Measures
This news release contains “non-GAAP financial measures”. The non-GAAP financial measures in this news release consist of non-GAAP income (loss) from operations which excludes non-cash stock-based compensation relative to income (loss) from operations calculated in accordance with GAAP. The non-GAAP financial measures also include non-GAAP net income (loss) which excludes non-cash stock-based compensation, foreign exchange gain (loss) and gain (loss) on change in fair value of derivative instruments relative to income (loss) calculated in accordance with GAAP. Non-GAAP financial measures should not be considered as a substitute for, or superior to, measures of financial performance prepared in accordance with GAAP. CounterPath utilizes both GAAP and non-GAAP financial measures to assess what it believes to be its core operating performance and to evaluate and manage its internal business and assist in making financial operating decisions. CounterPath believes that the inclusion of non-GAAP financial measures, together with GAAP measures, provides investors with an alternative presentation useful to investors’ understanding of CounterPath’s core operating results and trends.
i Desktop Virtualization Market Type – Organization Size – Vertical, Business Wire News